From 2G to 200M: How We Reduced Memory Usage Of An Event Sourcing Application In Elixir And Commanded
2022-02-13 Elixir Broadway Commanded Event Sourcing OOMKilled performance improvementHere at Zubale, we have an Elixir service built with Commanded, a framework for Event Sourcing. It worked pretty well, except its memory usage peaked during the business hours:
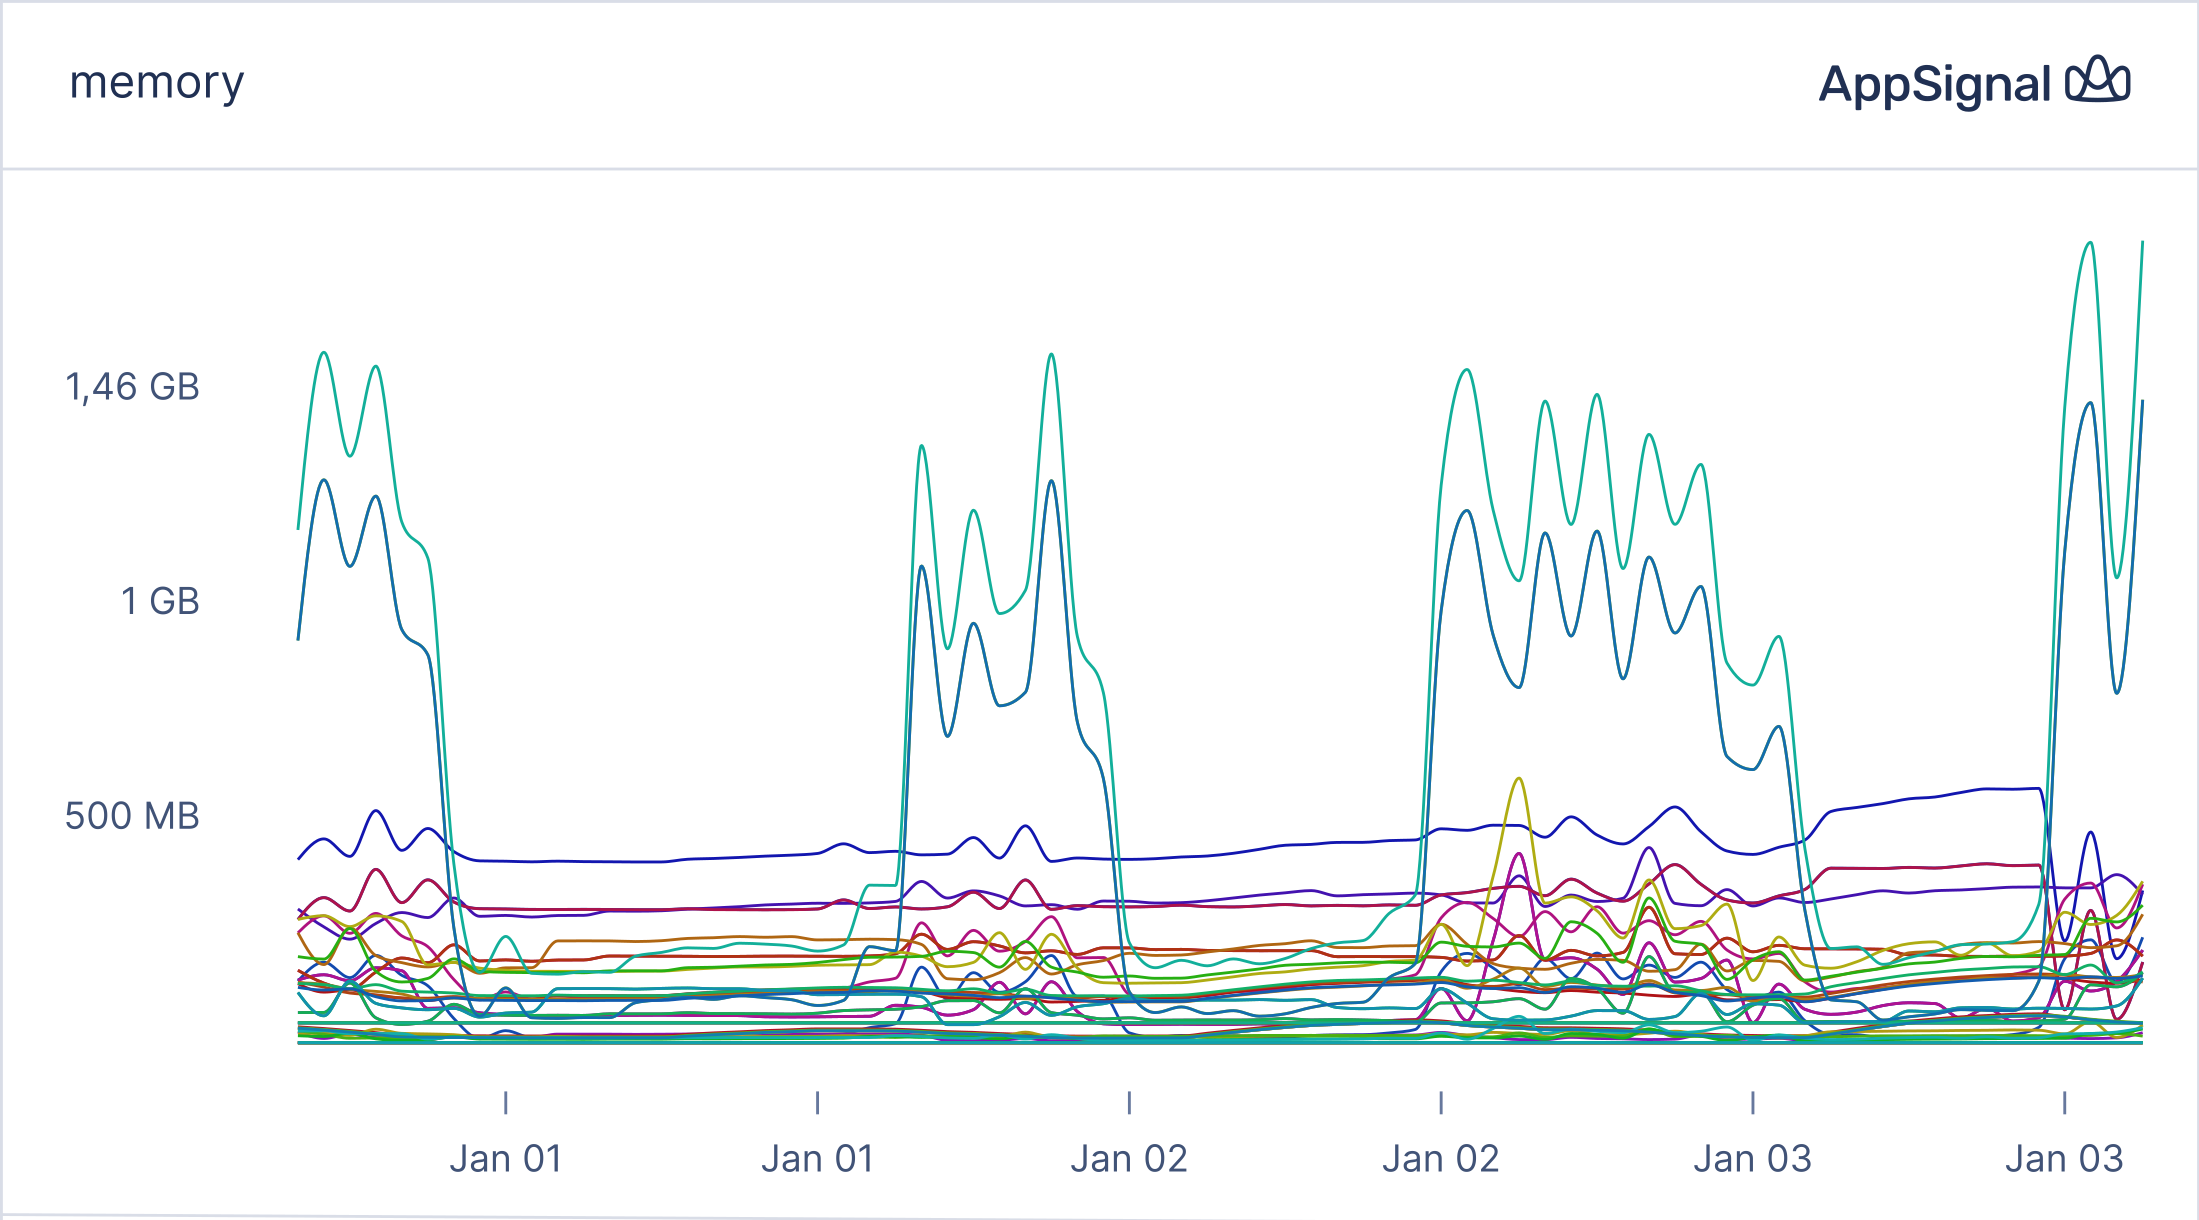
We don't expect it to be a flat line, but occasionally Kubernetes kills the pods because of out-of-memory errors. It led to many symptoms, and the application was unstable. We enabled auto horizontal scaling to keep it running without significant issues.
Things got worse when we recently brought a new component which consumed a considerably additional amount of memory. Soon, even at midnight when the load was low, we started receiving alerts after deployments:
Pod                     Ready  Status     Restarts  Age
my-app-8579bc575-7thcq  0/1    OOMKilled  4         9m52s
And we got an outage because of crash-looping pods.

Luckily we managed to fix it by reducing the memory usage. Turns out it was something we didn't pay enough attentions to when it came to the memory usage of Event Sourcing processes, and I want to share with you how we fixed the issue and what we learned along the way.
Before we jump into how we solved it, let me explain our architecture a bit.
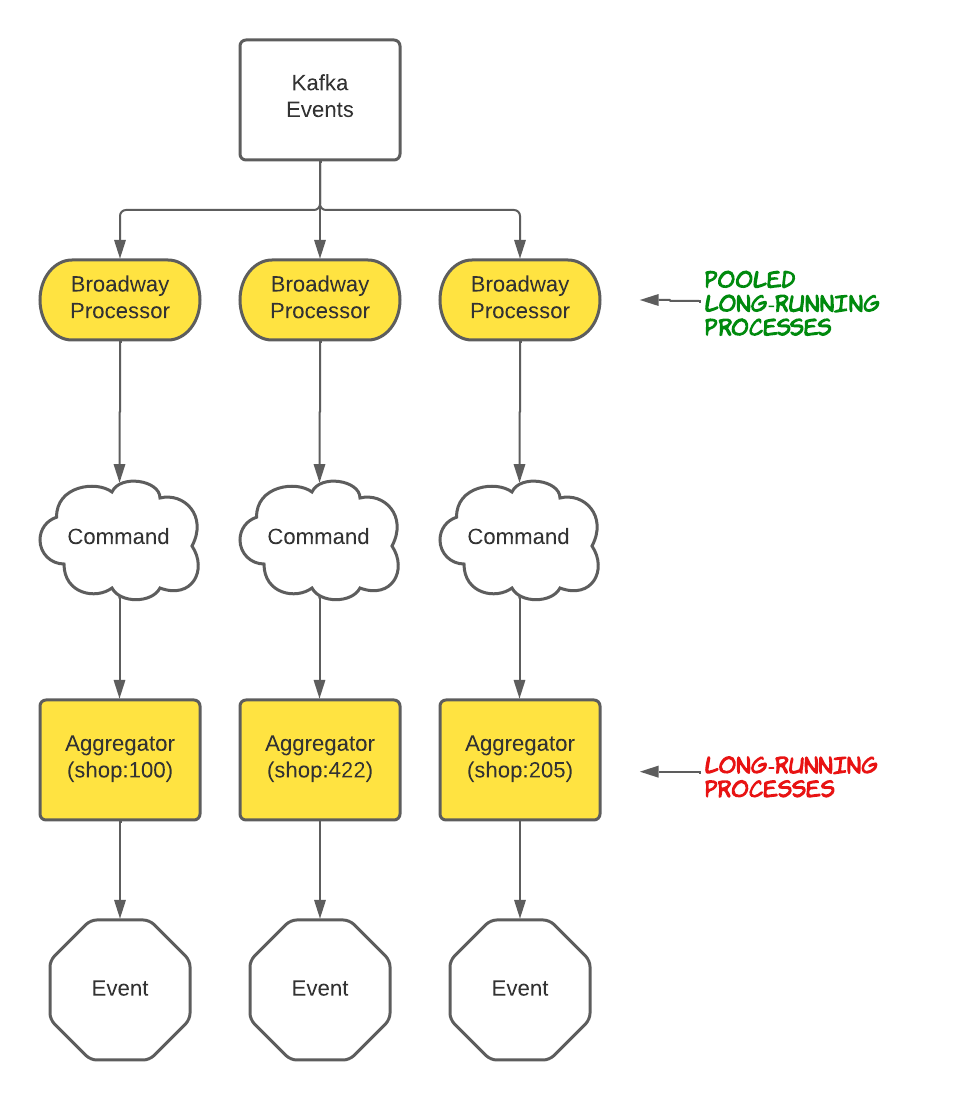
This service listens to our Apache Kafka instance with Broadway, and processes the messages with Broadway client processes which will dispatch a command to the event sourcing application. Inside the commanded application, the commands are processed by aggregators.
An aggregator process will be spawned to process the command. Commanded can reuse an existing process based on its identifier, without the need to spawn a new one. Here we identify our aggregators by their shop IDs. We have massive shops, and Commanded doesn't have pools for the aggregators, so N aggregator processes for N shops!
Our first approach was to reduce the concurrency of processing which, we hoped, would reduce the load from the source.
1. Reducing concurrency of data processing
Previously we configured our Broadway consumer's concurrency at 10. It usually works without a problem, but it will amplify the problem if the data processing requires too much memory. So our first attempt was to decrease it to 1, which was 10% as before:
Broadway.start_link(__MODULE__,
  name: __MODULE__,
  producer: [
    module: producer_module(),
    # the concurrency setting for watching the kafka events
    concurrency: 10 # <- we changed it to 1
  ],
  processors: [
    default: [
      # the concurrency setting for processing the event data
      concurrency: 10 # <- changed to 2
    ]
  ]
)
How did it work? Not so well. OOMKilled happened again.
Reducing processors helped but didn't solve it. It is evident now that the root cause was why the processing required so much memory. But at the time, we didn't realize that and had to try.
So, we came up with the next improvement.
2. Stop aggregators after any event
Aggregator processes are GenServers. They run forever by default. Whenever we have a event and we want to compute the state, we can directly compute it based on the event, and the previous state, which lives in memory. Re-calculating the state from all the historical events is avoided. However, the drawback is that the process always hold the state data in memory.
If we have thousands of such aggregate processes, the memory consumption can't be ignored.
Can we let the processes terminate themselves when they finished processing the events? Yes! We can explicitly set a lifespan for them to stop at specific points in time.
defmodule MyEventApp.Lifesmap do
  @behaviour Commanded.Aggregates.AggregateLifespan

  @impl true
  def after_event(_event), do: :stop

  @impl true
  def after_command(_command), do: :timer.minutes(1)

  @impl true
  def after_error(_error), do: :stop
end
In the above lifespan, we ask aggregators to terminate themselves after any event or error:
def after_event(_event), do: :stop
def after_error(_error), do: :stop
or 1 minute after any command and no message is received:
def after_command(_command), do: :timer.minutes(1)
This change helped a lot. However, there were still some occasional OOMs, though much less.
3. Snapshotting the aggregator
Since we let the aggregators terminate themselves after a event, what will happen if another command arrives?
Well, first, a new aggregator process will be spawned. Then the aggregator's state needs to be computed. Commanded computes the state by re-applying ALL the historical events from the very beginning. During the process, the apply/1 function of the aggregator module will be called multiple times, as the flowing diagram depicts:
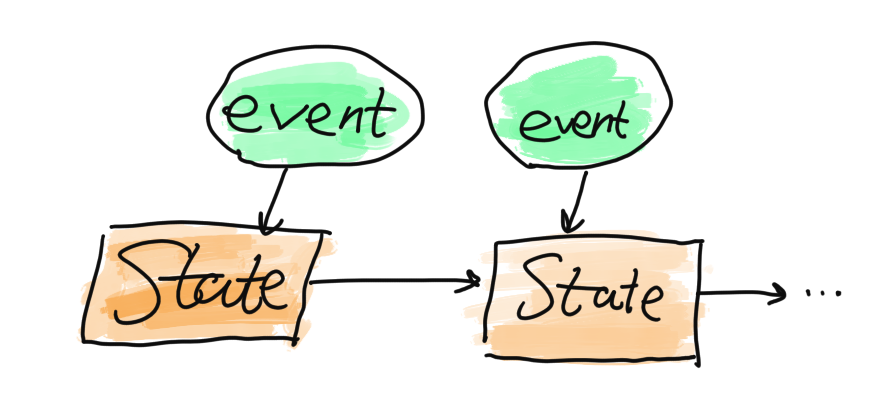
It certainly requires a considerable amount of memory if the number of events is enormous, or if there aren't that many events, but each event contains big data. We happened to have big data structs in the events.
Surprisingly, it's elementary to fix. Commanded provides a machanism called state snapshotting which saves the state every (configurable) X events.
The following code lets the event application save the state for MyApp.EventSourcing.MyAggregator in the database every ten events:
config :my_app, MyApp.EventSourcing.Application,
  snapshotting: %{
    MyApp.EventSourcing.MyAggregator => [
      snapshot_every: 10,
      snapshot_version: 1
    ]
  }
After the three fixes, finally the memory usage was brought down:
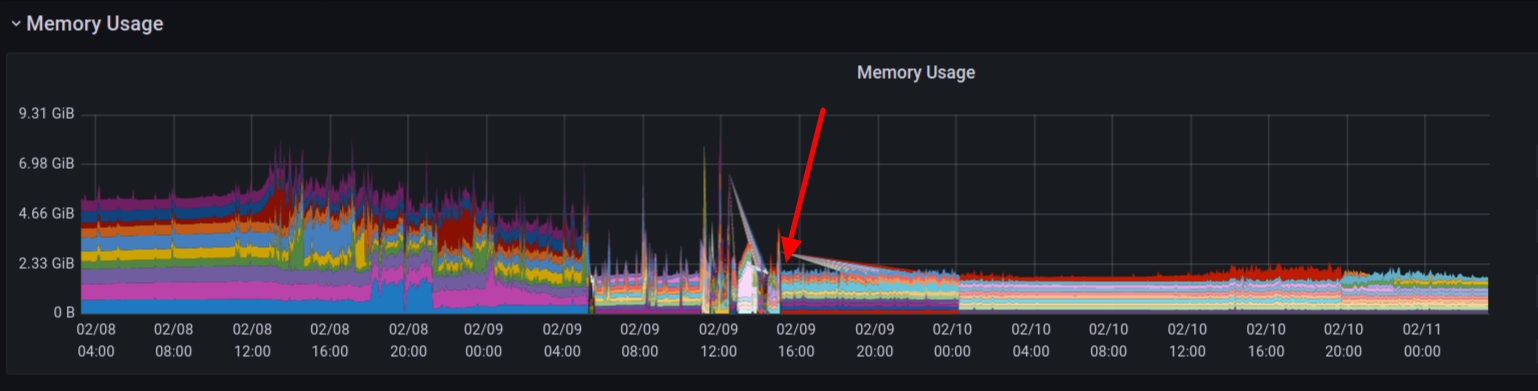
🎉🎉🎉🥳🥳🥳

The hero behind the scene: Phoenix LiveDashboard
We didn't know about these approaches at the beginning. Instead, we found them by using a fantastic tool provided by the community for free: Phoenix LiveDashboard. With LiveDashboard, we quickly saw that most of the memory was consumed by lots of aggregate processes.
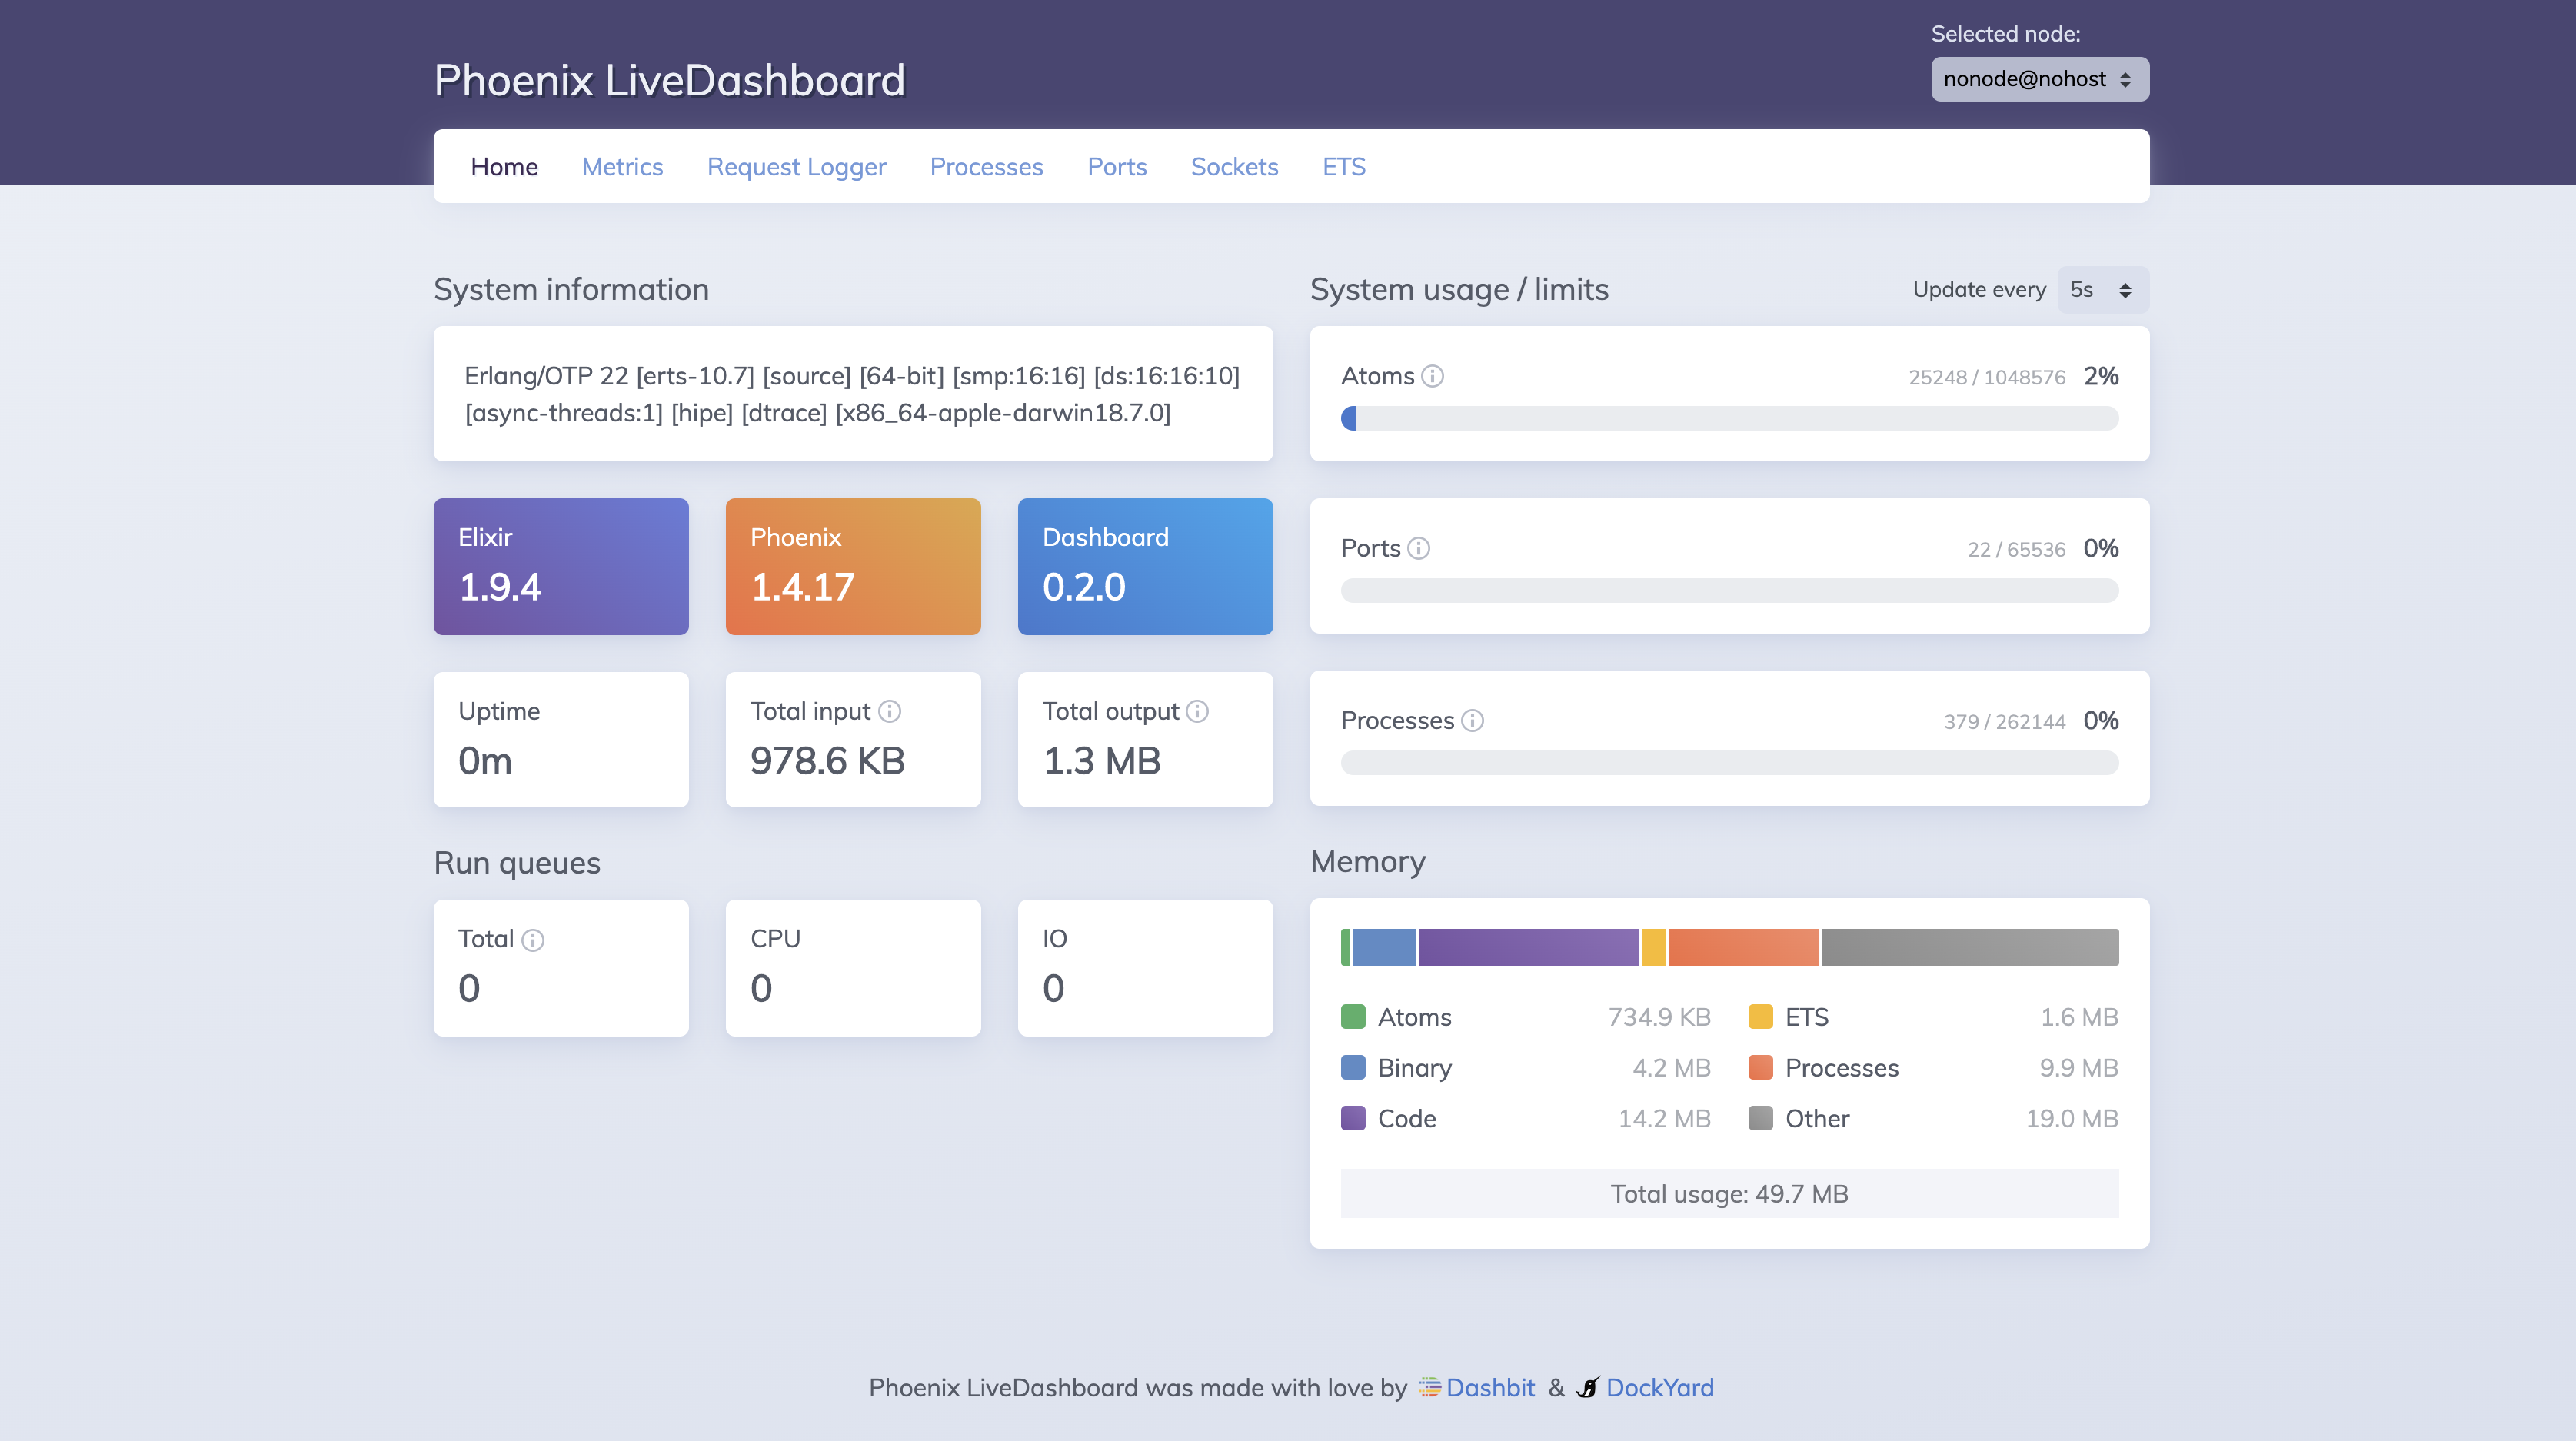 On the homepage, we can quickly get a sense of memory usage by different types of objects.
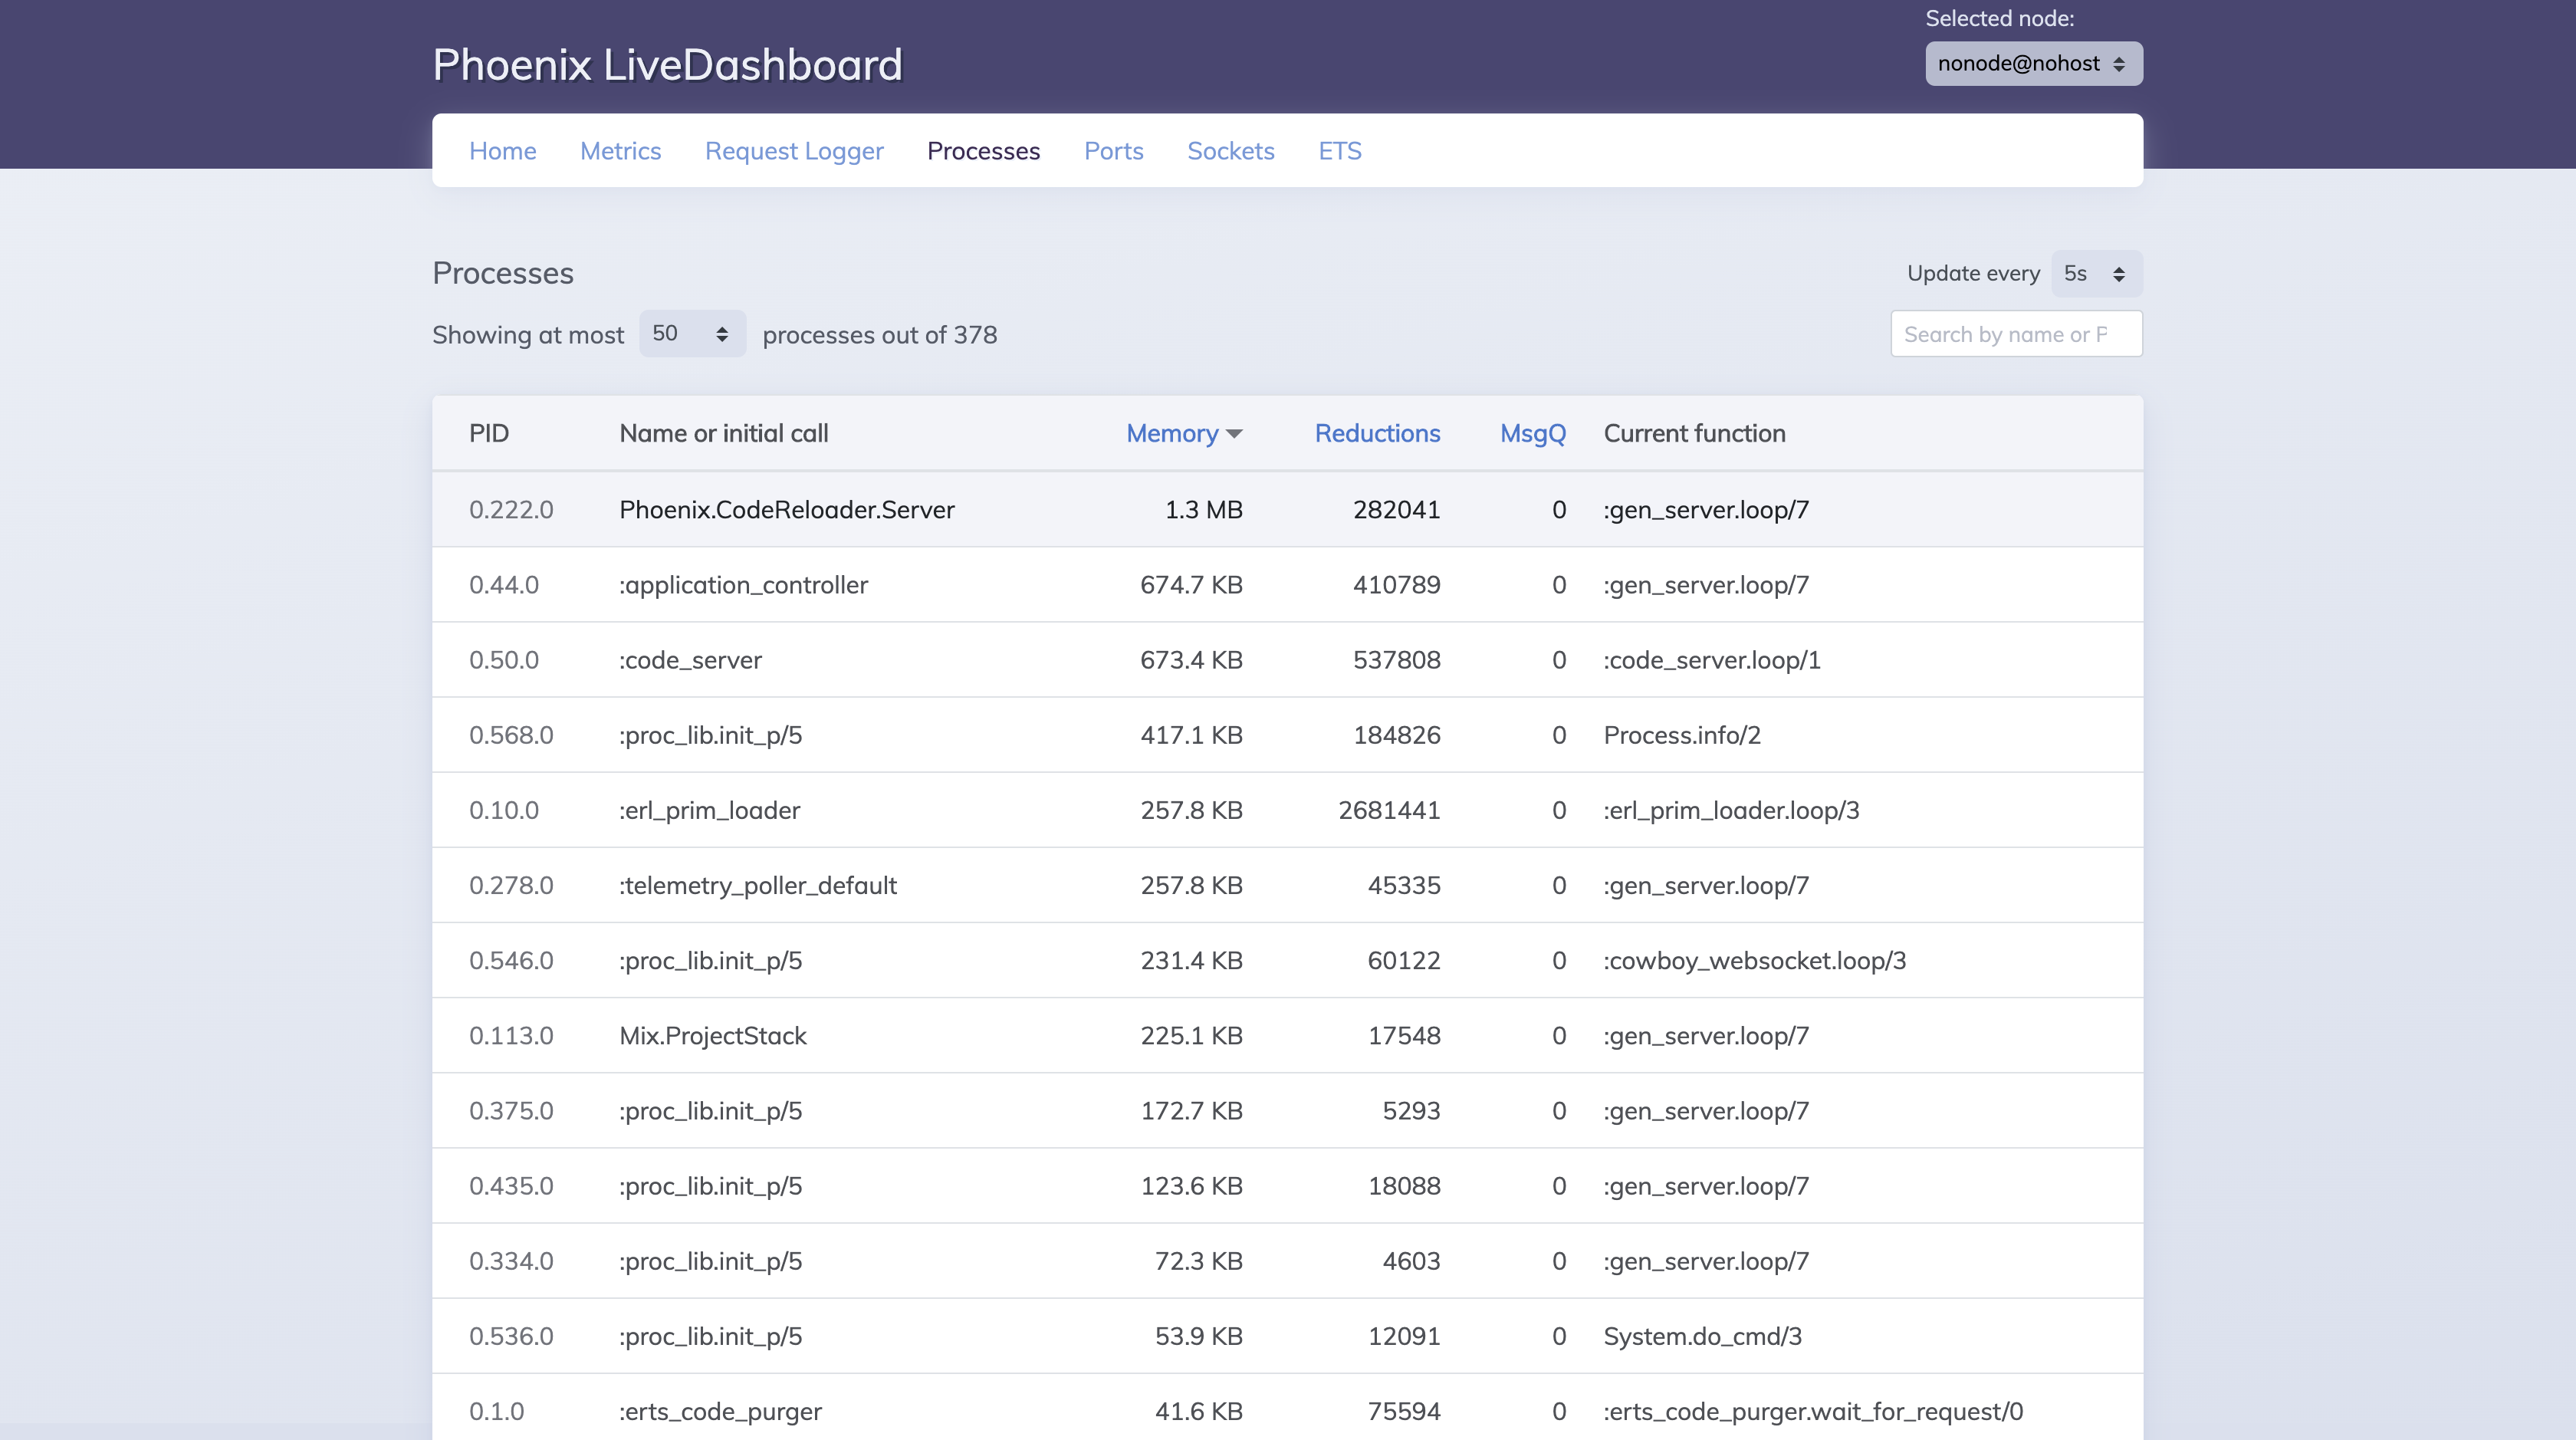 On the Processes page, we can observe memory usage per process.
Final word
Fixing the problem took less than an hour but knowing how to fix it was way longer. Fortunately, we learned:
- Reducing the memory usage in a Commanded Event Sourcing application by stopping aggregators after processing the event;
- Reducing the CPU and memory usage by snapshotting the aggregate state;
- Using LiveDashboard to ease the job of hunting memory monsters.
Thanks for reading, and I hope this post can be helpful to you too!
Comments